Showing posts with label 21 day exponential moving average. Show all posts

Thursday, May 27, 2010

Stock Charts Scary.......TLAB in play


Good Morning Stockhoppers, I hope you are surviving all the turbulence of this market. Yesterday I liquidated my Ford stock at 11.75 ...even though it is pointing up this morning in pre-market trading, I just do not like the chart formation on it,most stocks will cover a gap which I do expect will happen with Ford(see the gap on chart above). Many stocks are moving toward their 13 exponential moving average.

After reviewing the many stocks from the S & P 500 I seen one that stood out to me. TLAB, check out the chart above. The 13 day exponential moving average is ready to cross up over the 21 exponential moving average and has held up pretty well during this mini crash, I put my order in to trigger at 8.95.

The over all market still looks very shaky, they say things over in Europe are the cause of this, along with several other factors but just continue to watch your charts and the 13 day ema and 21 day ema they will not misguide you.

Until next time.....Chart wisely today!!!

Tuesday, May 25, 2010

Look Out Below!!! Update on Ford Stock


Good Morning Stockhoppers, Here we go again, in my last blog I threw in a word of caution. Well I hope you have been keeping a close eye on your money and adjusting your positions accordingly.
Lets get to it here this morning. Things are looking a little ugly here, and looking at the dow chart it may get worse. Yesterday we finished around the days low and could fall through support here today and if we do 
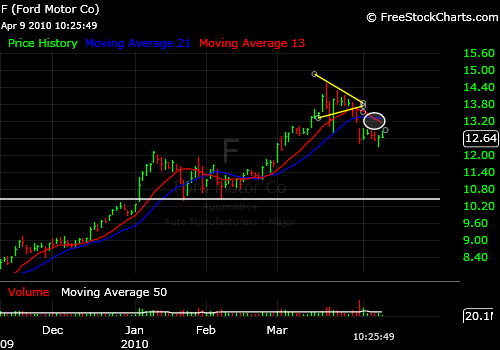
LOOK OUT BELOW!! and we will have to find new support before we see a turnaround. Today it is not looking good here. So if you are in for the short term I hope your stock(s) does not gap down today. Look at the dow chart we already have had a double bottom (1-2-3 formation). Look at our 13 day exponential moving average and our 21 day exponential moving average. The only real positive we have here today is that prices have moved away from the 13day ema and usually they will not stay away too long, but when the bottom falls out there are no rules with a crash, we have already seen a mini crash here with no real rebound which could lead to a major crash, I know it is a hard thing to do taking any loss but covering your positions now may save your money to re-invest when we find support here. Its all a part of being a serious trader, you have to get through these turbulent times.

Now for Ford, traders this is a bit scary, there has been quite a bit of good new(see the news really amounts to nothing, its all in the charts) yet the stock continues its slide. Look at the chart it is nearly identical to the Dow and could easily fall through support today. I am still long this stock and should have covered yesterday, I will take my own advice today and cover because we are looking at about a six month support level that it could break through and if it does there is no support in site and we could see year end 2009 levels. This is serious stuff here folks do not fall in to the same buy and hold trap that took so many traders and investors money in the last few years and left them with nothing. Live to trade another day!

No one cares about your money like you do........Until next time,Chart wisely today!

Tuesday, May 18, 2010

Time For Rebound? Ford Update


Hello Stockhoppers, It has been a little helter skelter here lately. We have fallen well below the 13day and 21 day exponential moving averages, are we seeing the bottom? Take a look at the Dow Jones Industrial chart, looks like we may have a 1-2-3 bottom forming, at least for the short term. We will not be sure until we see prices get back on top the 13day and 21day exponential moving averages. It looks like we are seeing the end of this downturn. What to watch for as we do approach the averages will prices hit and bounce off and return down or will they continue through and start to settle on top of these averages. Short term I would say there is money to be made by doing a little bargain hunting. Saying that I will also throw in a word of caution, get in make some money but watch out as they approach these averages.

Updating Ford which I am currently in long and in the Red with, it mirrors the Dow, this of course is not surprising. Ford should rebound as the market rebounds here. If you have money on the sidelines this would probably be a good play, but again watch as it approaches the 13day and 21 EMA. If you want to play it safe wait for it to bust above the #2 point on the chart, which it will most likely here real soon. If you are a little more adventurous you may want to play it now and keep a close eye on it as it approaches the #2pt and the averages.

How ever you play it keep a close eye on your money and the Charts!! Until next time....Happy Charting!!

Tuesday, May 4, 2010

Dow Jones Review/Wheres Ford Heading?


Good Morning Stockhoppers, This market is getting very topsy turvey(are those words). We are starting to see those large ups and downs which means.....uncertainty in the market!! For a long time now we have seen nice steady gains and just some healthy cooling off with the major indexes. Not so anymore. Take a look at the Dow Jones chart,look at the wider ranging days here the last week of trading. It tells the whole story of how the market feels right now UNDECIDED bulls win one the bears win one. Look for another day of consolidation while the Dow is forming its pennant.

Ford Motor technically is showing that the market is reacting to the other auto makers news. Ford is not the only game in town anymore!, this chart is also showing indecision of which way the traders want to go. Take a look at Fords chart,what has me concerned is that the 13 day exponential moving average is leveling off and slightly turning down toward the 21 day exponential moving average.

On the bright side this is a time many traders will make a lot of money trading these wide ranging days. Just keep reading the charts - the 21 day ema and the 13 day ema. Remember the old saying the trend is really your friend.

Until next time.....Happy Stock Charting!!

Thursday, April 22, 2010

AND THE STOCK CHARTS SAY.......................


Good Afternoon Stockhoppers, I am writing this about an hour after the close, and after looking at the charts and how the market reacted today I am going to say we are going to have a good day tomorrow. Anyone interested in getting in on Ford Stock? May not be a bad time. Take a look at the Ford Chart above. It is hitting on resistance of and finished near the days high. I am calling it a buy if it hits 14.30 and it should tomorrow. Another good sign......look at the 13 day exponential moving average!! it is getting ready to cross up and over the 21 day exponential moving average!! that is very good news for the buyers.

The Dow Jones chart is looking like it is also ready to tread into new territory as well. Again look at the Dow chart. It is up against its resistance but bounced off the 13 day EMA and the 21 day EMA. Look for follow through on Friday. 12000 here we come.

Until next time...........Watch your Charts

Wednesday, April 21, 2010

Dow and Ford - I told You!


Good Morning Stockhoppers and what a good morning it is turning out to be for the major markets and our spot light stock.....Ford, As I told you in a rare afternoon blog, that I bought 700 shares of Ford stock at 13.77 and it was tuned up for another good day today...well it is doing just that. As of this blog it is up near its high of the day around 14.14. What do we need to watch for now? Lets take a look at the Ford stock chart above. Notice that it is reaching a short term resistance level. So depending on your trading strategy, you may want to watch closely to see if it will bust through this resistance or bounce off resistance and pull back and rest before it makes its next push.

Notice the 21 day exponential moving average. It has flat lined which may mean a little pull back. The good news look at the 13 day exponential moving average,it is getting ready to cross up,over the 21 day EMA,very bullish signal here.

Now just as importantly lets take a look at the Dow Jones Industrial Average. Its is moving along nicely up the 13 day and 21 day exponential moving averages. Notice in the chart above that it is running into a little short term resistance at around 11150. Very similar chart to that of Ford. Overall market looks steady and strong.

I hope all your trades are are going great! and until next time....Study the Charts!!

Tuesday, April 20, 2010

Bought Ford At 13.77 Look for big rise tomorrow

I bought into ford (f) at 13.77. Reason? Take a look at the chart. Ford is riding the 21 day exponential moving average. The 13 day exponential moving average is just now pointing up and getting ready to cross the 21 EMA. This stock could explode tomorrow, seriously. Again I trade short term. Looking for short term explosions like the one I believe will happen tomorrow with Ford stock. I did have my eye on GE but after careful analysis of the charts I shifted gears and went with Ford stock. Keep an eye out and until next time.....watch your charts!!!

Thursday, April 15, 2010

Stock Market Review-Ford Stock Update


Good Morning Stockhoppers, Market showing strength again. All you have to do is read the stock charts and it tells us that this stock market is on a very steady climb in a upward direction.

Today we may see a slight pullback but I would not expect nothing drastic. It will probably come back to the 13 day exponential moving average and then continue its climb upward. At this point the market is very predictable.

If you read my blog yesterday you would have read that I was right on the nose in regard to ford stock, it did break out of its penant formation in an upward direction. Look at the Ford Stock Chart. Broke out nicely. Now what we have to watch today is if Ford stock will bounce back off the 21 day exponential moving average or will it get on top of the average. If if gets on top today that will signal a very bullish sign....stay tuned.

Until next time......Happy Stock Charting!!

Tuesday, April 13, 2010

Market Confusion - Ford Stock Update


Hello Stockhoppers I wish I could tell you why the market is climbing steady but surely, it actually looks rock solid, moving in a very quiet yet strong upward direction. Setting new high after new high and looking to do so AGAIN tomorrow. The whole stock market atmosphere seems just quietly optimistic, not getting to excited. That is what the stock market index charts are telling me. I believe if you are scanning the stock charts you can find some pretty good solid buys out there.

Take a look at the Stock Index Charts. Not too exciting just solid gains. Look how it is following the 13day exponential moving average. It looks like it will continue in this trend for at least the next couple of trades. This market definitely looks like it is a runner in a cross country race, just pacing itself. That all can change as we all know all too well. All the sudden the Stock Market may see itself as a sprinter, thus exhaust itself and fall back. For now looooking good! Yet I am very nervous about this market.

Ford stock is currently in a crossroads. I would say modestly optimistic. It very well could break out of its pennant shape tomorrow in a upward direction. I called that it would get down as low as 12.25 about a week and half ago. It sank to 12.34. I will not be bullish on Ford until it gets on top of the 21day exponential moving average, or even maybe the 13 day exponential moving average. You risk takers out there may try and guess the turn around........not me.

I am currently out of the Money with my short position with GE. I may be out tomorrow if it breaks above 19.13 I will let you know how that comes out. I still see some inconsistency with the latest gains. It seems to lose ground at the end of the day, for now I hold my short position. Well I am sorry this is so boring, but lets face so is the broad market right now.

Until next time.......Happy Stock Charting!!!

Friday, April 9, 2010

Todays Stock Market Update-Ford Showing Weakness


Good Morning Stockhoppers, The major indexes are looking pretty good today. It looks like the Dow will bounce off the 13 day ema. 11000 is definetly in sight now. Take a look at the Dow chart. It went down to the 21day ema yesterday to move bounce back above the 13day ema, this morning it went to the 13 day ema and looks to be ready to move upward.

As you all know I follow Ford stock very closely. I have made many dollars following the ups and downs of Ford(mostly ups here lately)but I would be very cautious of purchasing this stock and if I currently owned it, I would be watching very closely as I feel it could retreat here within the next few trading sessions. The Reason, simple, the 13 day ema has just crossed downward across the 21 day ema.
Another reason is that during the recent market up days Ford has not been rebounding as it should. Use today for example. Market is up around 35pts, Ford is barely hanging on to gains, around .04. That shows weakness. I will stick with my recent prediction that Ford stock will see 12.25 with the next stop being around 12.00.

Hope all your trades are profitable and until next time....Happy Stock Charting!!