Good Morning Stockhoppers, Earning reports still keep coming in mixed. Major indexes have been correcting a bit. One thing I notice with these markets here lately is that they will be down big during the day and come back at the end of the day, maybe not into positive territory but all the same they do rally back at the end of the day.....
What does this snap back tell me? The rubber band is not broke. The traders still believe in this market. Fundamentally the earnings have not been that bad. Many positive surprises. TECHNICALLY though...
Technically speaking this market is ready to rally!! we should see 3 to 4 days of gains here next week. Many stocks will rebound. After staying up late Friday night I analyzed the stocks that are poised to take full advantage of our mini rally forthcoming. Here they are!!
MBI - @ a break above 8.97 Earnings are coming out on Monday so trade accordingly, by the way they are suppose to beat estimates.
ETFC - @a break above 15.40. News has been neutral but traders taking interest here. Check the volume.
RF - @ a break above 7.51. News here is neutral,set up beautifully... technically speaking.
Yhoo - @ a break above 14.44. Another technical set-up. I guess it would help if deal with Japan comes through.
These are my picks to have large percentage gains. Others that you may want to put on your watch list are: ZION,DFS,HST,FTR,F,GE.
Hope these prove profitable for you and until next time......Chart wisely today!!
Signed
Master Stockhopper
Saturday, August 7, 2010

Saturday, July 24, 2010
Stock Shopping List
Hello Stockhoppers, I thought I would pass along a list of stocks that you should at least put on your stock shopping buy list as they are poised to advance on momentum. Here is my Stock Shopping List as of 7/24.
Low - break above 21.37
dhi - break above 10.99
cbg - break above 15.31
kg - break above 8.91
hrb- break above 15.36
df - break above 12.16
tlab- break above 7.75
tsn - break above 18.09
wmb - break above 19.84
ipg - break above 8.34
nwl - break above 15.93
amd - break above 7.94
I hope this helps you in your search for the next big mover. Until next time, I hope all your stocks are moving in the right direction.
Low - break above 21.37
dhi - break above 10.99
cbg - break above 15.31
kg - break above 8.91
hrb- break above 15.36
df - break above 12.16
tlab- break above 7.75
tsn - break above 18.09
wmb - break above 19.84
ipg - break above 8.34
nwl - break above 15.93
amd - break above 7.94
I hope this helps you in your search for the next big mover. Until next time, I hope all your stocks are moving in the right direction.
Wednesday, July 7, 2010
Pick a Stock Chart any Stock Chart
Hello Stockhoppers, Well it has been a while since I have touched base. Life has been busy but I have continued to follow this failing market. Oddly enough my last blog was somewhere around June 8th and i could use that same blog to describe things today, although because of the length of this downturn it makes it......well to keep it simple SCARY! this is if you are not short, if you are short this market kudos to you. I am not even going to post any charts today because most of them tell the exact same story and that is the bottom hopefully is coming soon but not many technical indicators are telling us this.
WHAT TO LOOK FOR NOW? I am waiting for the correction. Keep an eye on your exponential moving averages. We are see many double bottoms, will they break support? we will find out here soon. But yes there will be a correction, so my advice would be to keep that money on the sideline for now and wait to get FIRM CONFIRMATION on the correction and get on board. Currently I own just a few hundred shares of Tellab, I am currently in the red with this one but it is showing some promise of correcting.
I hope your trades are heading in the right direction and until next time happy stock charting!!
WHAT TO LOOK FOR NOW? I am waiting for the correction. Keep an eye on your exponential moving averages. We are see many double bottoms, will they break support? we will find out here soon. But yes there will be a correction, so my advice would be to keep that money on the sideline for now and wait to get FIRM CONFIRMATION on the correction and get on board. Currently I own just a few hundred shares of Tellab, I am currently in the red with this one but it is showing some promise of correcting.
I hope your trades are heading in the right direction and until next time happy stock charting!!
Tuesday, June 8, 2010
13 Day EMA DID NOT LIE-Look at the Major Indices


Good Morning Stockhoppers, In my last blog I stated that the 13 day EMA was telling us a SHORT STORY here we are on Tuesday morning wondering if the major indices will find support levels. We have been this low recently, the major difference is that in the past when we got to these levels we ended the trading day up near the days high. Take a look at these index charts.
You can see that the indexes are poised to move lower and break major support levels. The floors are starting to creak and rattle. If it gives way we could be looking at a major windfall, freefall.... call it what you will. I hope you are watching your trades very carefully, and are not staying with the ole buy and hold strategies.
Today will be a very pivotal day. Stay Tuned and Chart Wisely Today!!!
Tuesday, June 1, 2010
13 Day EMA tells a SHORT STORY


Good Morning Stockhoppers, I hope you all had a good Memorial Day weekend. Well taking off from my last blog "Will We See Follow Through".....not looking so good lets get right to it and look at the Dow Jones and Nasdaq charts. Looks like this morning they are going to bounce off the 13 day EMA(Exponential Moving Average)and head south. This market is not ready to rebound as of the short term. Money to be made shorting? ....possible but be careful.
I have a small long position in TLAB which is currently in the black. This market has to tell me that it is ready to get back on top the 13 day EMA and stabilize a bit before I take on more positions. Again there is money to be made on these wide swings but tread very carefully and be patient.
Until next time Chart Wisely Today!!!
Friday, May 28, 2010
Will We See Any Follow Through??!!!!
Good Morning Stockhoppers, No charts today, I would imagine if you are in or got in the market yesterday you made some money....if you did not...well that is just bad luck as the market obviously surged yesterday.
Lets look at the real question at hand. WILL WE SEE FOLLOW THROUGH!!?? look at most any chart and you will see that they are at or approaching their 13 day exponential moving average the million dollar question, will we see the follow through or will it bounce off the 13 ema and move south.
Be very careful here, it is very easy to become overly optimistic after a day like yesterday. Be a smart trader, if you study the charts you know there is always an opportunity somewhere..be patient as I have preached over and over again. Remember the market always seems to be in a good mood right before a holiday.
Have a great memorial day weekend, get some rest...and until next time..chart wisely today.
Lets look at the real question at hand. WILL WE SEE FOLLOW THROUGH!!?? look at most any chart and you will see that they are at or approaching their 13 day exponential moving average the million dollar question, will we see the follow through or will it bounce off the 13 ema and move south.
Be very careful here, it is very easy to become overly optimistic after a day like yesterday. Be a smart trader, if you study the charts you know there is always an opportunity somewhere..be patient as I have preached over and over again. Remember the market always seems to be in a good mood right before a holiday.
Have a great memorial day weekend, get some rest...and until next time..chart wisely today.
Thursday, May 27, 2010
Stock Charts Scary.......TLAB in play


Good Morning Stockhoppers, I hope you are surviving all the turbulence of this market. Yesterday I liquidated my Ford stock at 11.75 ...even though it is pointing up this morning in pre-market trading, I just do not like the chart formation on it,most stocks will cover a gap which I do expect will happen with Ford(see the gap on chart above). Many stocks are moving toward their 13 exponential moving average.
After reviewing the many stocks from the S & P 500 I seen one that stood out to me. TLAB, check out the chart above. The 13 day exponential moving average is ready to cross up over the 21 exponential moving average and has held up pretty well during this mini crash, I put my order in to trigger at 8.95.
The over all market still looks very shaky, they say things over in Europe are the cause of this, along with several other factors but just continue to watch your charts and the 13 day ema and 21 day ema they will not misguide you.
Until next time.....Chart wisely today!!!
Wednesday, May 26, 2010
Dow Jones Bounces Off Support Levels.....Ford Covers Early Gap Down


Good Morning Stockhoppers, Whew, the market did recover after a miserable Tuesday morning. Support levels are holding up and with the Dow Jones only posting a modest lost yesterday, we should see some follow through today.
Notice on the Dow chart that prices are a long way from the 13 day exponential moving average. This is what we need to keep an eye on as it bounces back toward this average. When it reaches these levels I will be putting a stop loss right below to eliminate any risk that this market will bounce off the 13 day ema and take another dive. The whole point here is that many traders lost allot of money in the so called mini crash, when it was totally unnecessary. This market is very unpredictable so protect yourself.
Ford also recovered nicely yesterday as it filled in its early morning gap down(as you can count on most stocks and averages will do this that is why I did not sell out of my position)in late afternoon trading. Ford is also holding at support levels. I did have a stop-loss placed at 10.15 just in case it broke down these levels,the stop loss remains in tact today, although I do expect a nice follow through today for Ford. PLEASE STAY ON TOP OF THIS MARKET. We are definetly not out of the woods. When Ford stock gets to its 13 ema set your stop-loss and protect yourself. No one cares about your money like you do.
Well until next time.....Chart Wisely Today!!!
Tuesday, May 25, 2010
Intra Day Update- Ford Holding Support
Good Afternoon Stockhoppers, Talking with you earlier we were watching our support levels and the 13day ema. So far we are holding at support levels with the market trying to rebound here in late day trading. Watch for your stocks to cover their gaps, that is what should happen here. The Dow is not close as of yet to covering the gap down from this morning terrible open. Continue to watch the support levels. If we can show some recovery here late it should spill over to tomorrows trading session. The Dow is quite a long way from the 13 ema, so we should see it move closer in the next session. CAUTION! be careful as it gets close it may bounce off and make another run lower at the support levels.
Ford has come close to covering the gap down from this morning. Look at the chart Ford is also holding onto support levels, but the chart is not pretty. It needs to finish near the days high, the difference in Ford and the major averages is that it is closer to its 13 day exponential moving average, which may indicate continued weakness. Keep watching the support levels and if it falls through take cover.
Until next time chart wisely today
Ford has come close to covering the gap down from this morning. Look at the chart Ford is also holding onto support levels, but the chart is not pretty. It needs to finish near the days high, the difference in Ford and the major averages is that it is closer to its 13 day exponential moving average, which may indicate continued weakness. Keep watching the support levels and if it falls through take cover.
Until next time chart wisely today
Look Out Below!!! Update on Ford Stock


Good Morning Stockhoppers, Here we go again, in my last blog I threw in a word of caution. Well I hope you have been keeping a close eye on your money and adjusting your positions accordingly.
Lets get to it here this morning. Things are looking a little ugly here, and looking at the dow chart it may get worse. Yesterday we finished around the days low and could fall through support here today and if we do LOOK OUT BELOW!! and we will have to find new support before we see a turnaround. Today it is not looking good here. So if you are in for the short term I hope your stock(s) does not gap down today. Look at the dow chart we already have had a double bottom (1-2-3 formation). Look at our 13 day exponential moving average and our 21 day exponential moving average. The only real positive we have here today is that prices have moved away from the 13day ema and usually they will not stay away too long, but when the bottom falls out there are no rules with a crash, we have already seen a mini crash here with no real rebound which could lead to a major crash, I know it is a hard thing to do taking any loss but covering your positions now may save your money to re-invest when we find support here. Its all a part of being a serious trader, you have to get through these turbulent times.
Now for Ford, traders this is a bit scary, there has been quite a bit of good new(see the news really amounts to nothing, its all in the charts) yet the stock continues its slide. Look at the chart it is nearly identical to the Dow and could easily fall through support today. I am still long this stock and should have covered yesterday, I will take my own advice today and cover because we are looking at about a six month support level that it could break through and if it does there is no support in site and we could see year end 2009 levels. This is serious stuff here folks do not fall in to the same buy and hold trap that took so many traders and investors money in the last few years and left them with nothing. Live to trade another day!
No one cares about your money like you do........Until next time,Chart wisely today!
Tuesday, May 18, 2010
Time For Rebound? Ford Update


Hello Stockhoppers, It has been a little helter skelter here lately. We have fallen well below the 13day and 21 day exponential moving averages, are we seeing the bottom? Take a look at the Dow Jones Industrial chart, looks like we may have a 1-2-3 bottom forming, at least for the short term. We will not be sure until we see prices get back on top the 13day and 21day exponential moving averages. It looks like we are seeing the end of this downturn. What to watch for as we do approach the averages will prices hit and bounce off and return down or will they continue through and start to settle on top of these averages. Short term I would say there is money to be made by doing a little bargain hunting. Saying that I will also throw in a word of caution, get in make some money but watch out as they approach these averages.
Updating Ford which I am currently in long and in the Red with, it mirrors the Dow, this of course is not surprising. Ford should rebound as the market rebounds here. If you have money on the sidelines this would probably be a good play, but again watch as it approaches the 13day and 21 EMA. If you want to play it safe wait for it to bust above the #2 point on the chart, which it will most likely here real soon. If you are a little more adventurous you may want to play it now and keep a close eye on it as it approaches the #2pt and the averages.
How ever you play it keep a close eye on your money and the Charts!! Until next time....Happy Charting!!
Tuesday, May 4, 2010
Dow Jones Review/Wheres Ford Heading?


Good Morning Stockhoppers, This market is getting very topsy turvey(are those words). We are starting to see those large ups and downs which means.....uncertainty in the market!! For a long time now we have seen nice steady gains and just some healthy cooling off with the major indexes. Not so anymore. Take a look at the Dow Jones chart,look at the wider ranging days here the last week of trading. It tells the whole story of how the market feels right now UNDECIDED bulls win one the bears win one. Look for another day of consolidation while the Dow is forming its pennant.
Ford Motor technically is showing that the market is reacting to the other auto makers news. Ford is not the only game in town anymore!, this chart is also showing indecision of which way the traders want to go. Take a look at Fords chart,what has me concerned is that the 13 day exponential moving average is leveling off and slightly turning down toward the 21 day exponential moving average.
On the bright side this is a time many traders will make a lot of money trading these wide ranging days. Just keep reading the charts - the 21 day ema and the 13 day ema. Remember the old saying the trend is really your friend.
Until next time.....Happy Stock Charting!!
Thursday, April 22, 2010
AND THE STOCK CHARTS SAY.......................


Good Afternoon Stockhoppers, I am writing this about an hour after the close, and after looking at the charts and how the market reacted today I am going to say we are going to have a good day tomorrow. Anyone interested in getting in on Ford Stock? May not be a bad time. Take a look at the Ford Chart above. It is hitting on resistance of and finished near the days high. I am calling it a buy if it hits 14.30 and it should tomorrow. Another good sign......look at the 13 day exponential moving average!! it is getting ready to cross up and over the 21 day exponential moving average!! that is very good news for the buyers.
The Dow Jones chart is looking like it is also ready to tread into new territory as well. Again look at the Dow chart. It is up against its resistance but bounced off the 13 day EMA and the 21 day EMA. Look for follow through on Friday. 12000 here we come.
Until next time...........Watch your Charts
Wednesday, April 21, 2010
Dow and Ford - I told You!


Good Morning Stockhoppers and what a good morning it is turning out to be for the major markets and our spot light stock.....Ford, As I told you in a rare afternoon blog, that I bought 700 shares of Ford stock at 13.77 and it was tuned up for another good day today...well it is doing just that. As of this blog it is up near its high of the day around 14.14. What do we need to watch for now? Lets take a look at the Ford stock chart above. Notice that it is reaching a short term resistance level. So depending on your trading strategy, you may want to watch closely to see if it will bust through this resistance or bounce off resistance and pull back and rest before it makes its next push.
Notice the 21 day exponential moving average. It has flat lined which may mean a little pull back. The good news look at the 13 day exponential moving average,it is getting ready to cross up,over the 21 day EMA,very bullish signal here.
Now just as importantly lets take a look at the Dow Jones Industrial Average. Its is moving along nicely up the 13 day and 21 day exponential moving averages. Notice in the chart above that it is running into a little short term resistance at around 11150. Very similar chart to that of Ford. Overall market looks steady and strong.
I hope all your trades are are going great! and until next time....Study the Charts!!
Tuesday, April 20, 2010
Bought Ford At 13.77 Look for big rise tomorrow
I bought into ford (f) at 13.77. Reason? Take a look at the chart. Ford is riding the 21 day exponential moving average. The 13 day exponential moving average is just now pointing up and getting ready to cross the 21 EMA. This stock could explode tomorrow, seriously. Again I trade short term. Looking for short term explosions like the one I believe will happen tomorrow with Ford stock. I did have my eye on GE but after careful analysis of the charts I shifted gears and went with Ford stock. Keep an eye out and until next time.....watch your charts!!!
Market Poised to move forward,GE to bounce up, Ford ?


Good morning Stockhoppers, Its Tuesday morning and all is well with the major markets. Looking at the Dow Industrial Chart this morning it looks like we will see a bounce off the 13 day exponential moving average. No surprise here it has done this several times in the last month(take a look at the chart). It is a good time to select your favorite stock that you have been tracking. I am thinking 11,200 here real soon!
Lets take a look at GE(I am currently short this stock at 17.93)I will be reversing my position if it does indeed bounce off the 13 day exponential moving average, which it looks like it is ready to do. So I will take my loss and move on, hopefully only to recoup it in the next couple of sessions. NOTE I am not chasing this stock. The chart is setup and telling me that it has a very good chance that it will indeed bounce off the 13 day EMA, otherwise I would be looking elsewhere to move my money.
As for Ford Stock, I see that this stock has not decided as of yet which way it is going. Look at the chart. It is just kind of consolidating a bit, meaning to me that traders are really undecided on the position they want to commit to ford. The good news is that it is showing support around 13.30. and notice the 13 day exponential moving average. It is forming an under belly of support and ready to move upward. Watch for the upward cross over of the 21 day exponential moving average, this will be a very bullish signal.
Until next time.......Keep Watching those charts!!!
Thursday, April 15, 2010
Stock Market Review-Ford Stock Update


Good Morning Stockhoppers, Market showing strength again. All you have to do is read the stock charts and it tells us that this stock market is on a very steady climb in a upward direction.
Today we may see a slight pullback but I would not expect nothing drastic. It will probably come back to the 13 day exponential moving average and then continue its climb upward. At this point the market is very predictable.
If you read my blog yesterday you would have read that I was right on the nose in regard to ford stock, it did break out of its penant formation in an upward direction. Look at the Ford Stock Chart. Broke out nicely. Now what we have to watch today is if Ford stock will bounce back off the 21 day exponential moving average or will it get on top of the average. If if gets on top today that will signal a very bullish sign....stay tuned.
Until next time......Happy Stock Charting!!
Tuesday, April 13, 2010
Market Confusion - Ford Stock Update


Hello Stockhoppers I wish I could tell you why the market is climbing steady but surely, it actually looks rock solid, moving in a very quiet yet strong upward direction. Setting new high after new high and looking to do so AGAIN tomorrow. The whole stock market atmosphere seems just quietly optimistic, not getting to excited. That is what the stock market index charts are telling me. I believe if you are scanning the stock charts you can find some pretty good solid buys out there.
Take a look at the Stock Index Charts. Not too exciting just solid gains. Look how it is following the 13day exponential moving average. It looks like it will continue in this trend for at least the next couple of trades. This market definitely looks like it is a runner in a cross country race, just pacing itself. That all can change as we all know all too well. All the sudden the Stock Market may see itself as a sprinter, thus exhaust itself and fall back. For now looooking good! Yet I am very nervous about this market.
Ford stock is currently in a crossroads. I would say modestly optimistic. It very well could break out of its pennant shape tomorrow in a upward direction. I called that it would get down as low as 12.25 about a week and half ago. It sank to 12.34. I will not be bullish on Ford until it gets on top of the 21day exponential moving average, or even maybe the 13 day exponential moving average. You risk takers out there may try and guess the turn around........not me.
I am currently out of the Money with my short position with GE. I may be out tomorrow if it breaks above 19.13 I will let you know how that comes out. I still see some inconsistency with the latest gains. It seems to lose ground at the end of the day, for now I hold my short position. Well I am sorry this is so boring, but lets face so is the broad market right now.
Until next time.......Happy Stock Charting!!!
Friday, April 9, 2010
Todays Stock Market Update-Ford Showing Weakness

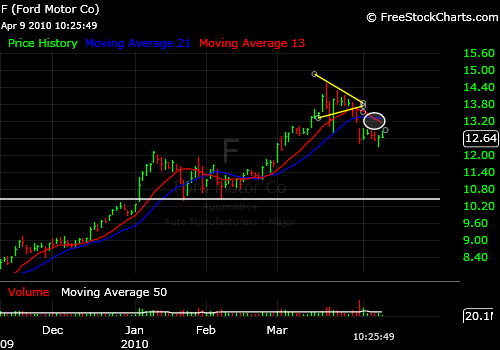
Good Morning Stockhoppers, The major indexes are looking pretty good today. It looks like the Dow will bounce off the 13 day ema. 11000 is definetly in sight now. Take a look at the Dow chart. It went down to the 21day ema yesterday to move bounce back above the 13day ema, this morning it went to the 13 day ema and looks to be ready to move upward.
As you all know I follow Ford stock very closely. I have made many dollars following the ups and downs of Ford(mostly ups here lately)but I would be very cautious of purchasing this stock and if I currently owned it, I would be watching very closely as I feel it could retreat here within the next few trading sessions. The Reason, simple, the 13 day ema has just crossed downward across the 21 day ema.
Another reason is that during the recent market up days Ford has not been rebounding as it should. Use today for example. Market is up around 35pts, Ford is barely hanging on to gains, around .04. That shows weakness. I will stick with my recent prediction that Ford stock will see 12.25 with the next stop being around 12.00.
Hope all your trades are profitable and until next time....Happy Stock Charting!!
Thursday, April 8, 2010
Todays Stock Chart Check-Update on Ford


Hello Stockhoppers, The Dow is taking a little time off here as traders look to be taking some money out and are a little nervous about the 11000 mark. The Dow chart is showing this morning that there is not alot to be alarmed about. It has not broke down its short term resistance nor is it down to the 21day ema as of yet. These are the two criteria that I am following right now to gauge the sentiment of this market.
As Far as Ford stock goes, take a look at the stock chart. It is, up to this point doing exactly what I blogged about a couple of days ago. I said it will hit 12.25 with a chance of 12.00. Keep watching this stocks 13day and 21 day ema, as you can see it is crossing in a downward direction with the 13day crossing down over the 21day, a very short term bearish sign for Ford stock. Part of what the stock chart is telling us is that other auto stocks are coming out with decent to good news, so traders in this sector are buying else where.
My active trade is (I shorted 500 shares of GE at 17.93)I am holding that position as it is under the 13day ema and should at least go to the 21day ema. I am watching this position very closely. If I see a better opportunity here and Ge starts new trend I will liquidate the positon and take the small loss. That is all for now
and until next time..........Happy Stock Charting!!
Subscribe to:
Posts (Atom)
