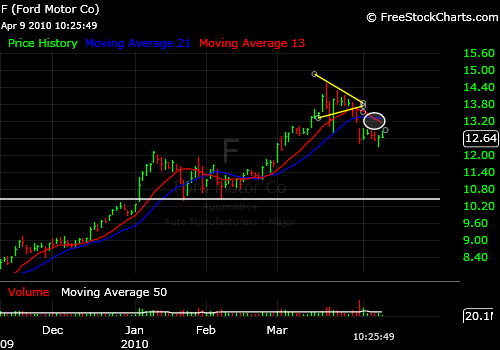
Charting stocks and making a good profit is not as hard as the pros want you to believe that it is. Yes there are some criteria involved that
separate the good traders from the washed out traders but it is very possible for you to make good money from watching your own money instead of just handing it over to some investment advisor, don't get me wrong there are some very good
advisers, all I am saying is that no one cares more about your money than...... you do.
Charting stocks or technical
analysis of a company allows you to gauge a
company's momentum or lack there of by looking at the trend of the stocks price through a certain period of time. It gives you a snapshot you could say of how that
company's stock is performing and even the likely hood of if it will continue or not.
This is where you profit. You can make a profit on the way up or you can profit if the stock is going down. No having to look at any ratios, studying the
company's earnings and revenues or dissecting the year end books, because it is all baked in the chart, the story of how well or how poor the company is doing is right on the chart and reading it is easier than you think.
Once you understand the universal principles of charting you will be able to use them in any market whether it would be stocks, options, futures, or any market for that matter. You will be able to tell who is winning the bears or the bulls, for the
chartists it really does not matter.
Going back to the criteria that makes a good trader..... here is my list:
1)
You must be disciplined - do not let yourself get caught up in greed. A good trader stays calm, cool and collected. Manage your emotions and read what the chart is telling you and you will be profitable.
2)
Patient,Patient,Patient - I cannot stress this enough. Don't feel that you have to be in the market all the time, don't feel like your missing an opportunity just because you are not in. Some of your best trades will be the ones you decided not to get into. Let the market come to you, do not chase it.
That's it! those are the two personal criteria you will need to be a
successful trader.
There are some terms that you will want to get use to like
resistance ( a certain price point that the stock repeatedly will go up to but not break through) and
support ( a certain price point that a stock will repeatedly go down to but always seems to bounce back from).
When researching and studying different styles of charting stocks you will hear about chart patterns such as flags, pennants,channels,1-2-3 bottom and tops, head and shoulder, the list goes on and on.
You will also hear of charting tools that may help you decide when there is a good opportunity. Some of these are: Moving averages,
Bollinger Bands,
stochastics, Oscillators, RSI, Williams % R,
MACD...again the list goes on. There have been many books sold on these(I have actually read many of them) individual methods. These can be very contradictory and hard to evaluate.
My rule is KISS, you know Keep It Simple Student, because anyone involved in studying the market always continues to be a student. HERE IS HOW I HAVE BEEN SUCCESSFUL. I use the 21 day and the 14 day exponential moving average on a high,low,open,close style bar chart.

I start out by applying them to the DOW, S & P 500 and the NASDAQ exchanges, this gives me a very good idea of which direction the major indices are moving.
I figure out what the trend is, then I study and analyze all the stocks in the S & P 500(I do this at night after the market has closed) that are in my price range and decide which chart is showing me the best opportunity. The reason I use these stocks are because they are high volume stocks which means that they are very actively bought and sold and for me that makes them a bit more predictable.
When I find the charts that are interesting to me I then check the news on them to make sure there wasn't any major news out on them after the market closed that could effect the price of that stock the next day.
I then put in an order to purchase that stock at a price higher than the previous days high, anywhere from 7 to 10 cents higher. Why you ask? because I want to know that the momentum is going to continue and that my
study of the stock was, at least on the open correct.
Once my stock hits my predetermined price and is purchased I continually watch it on a daily basis making sure it is continuing up the 14 and or 21 day moving average, along with watching for any breaking news on my stock that could drastically change the price of the stock.
Now for maybe the most important part WHEN TO EXIT YOUR POSITION. Not only is it important to buy right it is also as or more important to know when to sell. There are a couple of ways to do this. When starting out and you just made a nice profit and are getting nervous, GET OUT!! TAKE YOUR PROFIT!! but do yourself a big favor, find out why it was a good trade, what are the things you did right, NEVER beat yourself up when you look at the stock the next day and it went up another 10%. You made a profit, be happy and look to the next opportunity.
What I do is look at the chart and news everyday and ask myself would I buy this stock today? If my answer is yes then I hold it, if my answer is no I put in my order to sell, I take the emotion out of it. It is that cut and dry for me. Like I said earlier KEEP THE EMOTION OUT OF THE TRADE.
When Charting Stocks I never look to get in at the very bottom and out at the very top, I like to take my profit out of the middle, it is less risky.
I love the art of technical trading. I work on polishing my craft everyday. I created this Blog to find others that feel the same way and to exchange ideas and to invite people that maybe have just started or are just curious of how this can work for them.
I painted this subject with a broad brush, so do some reading on the subject of technical analysis there is not a shortage of reading material out there believe me. Let me know your thoughts.
I will continue to post in more depth on the subjects of Charting Stocks and even let you know what I am trading and the results(doing this really helps me stay focused). Currently I am on the sidelines looking for my next opportunity. Let me know how you are doing.
I am currently what I would call a part time trader, I am 43 years old, have six children and I do have another job (Realtor) but my passion is trading. I have been studying the different aspects of trading for over 15 years. I have taken my share of lumps playing options and futures, I now totally concentrate on just the stock market, it is what suits me best and where I am most comfortable. Last year 2009 was my best, I made approximately 80% on my money, and its all about being DISCIPINED and PATIENT! and over the last 6years trading has added a nice supplement to my income. I do take money out of the market because it makes it more real. Nothing nicer than seeing a check come from your brokerage firm. I know...I know
Warren Buffet never sells a stock, well if I had a plane to fly all over the world to check out businesses that I might be interested in buying then maybe I wouldn't sell either. The only thing I think I have in common with
Warren Buffet is that we both love what we do.
I hope this has helped you in some way or at least peaked your interest, again stayed tuned and jump in and participate....I would love to hear from you.
By the way I always advise people who are just starting out to take a month or Ten and practice, there are many brokerage companies that will set up ficticious accounts for you to do dry runs and get a feel for the process without the risk. You will know when your ready for the real thing.
Until next time...When we will talk about specific entry and exit points and my most current position(s) in the market.......... Happy Charting!!